End-to-end supply chain visibility means seeing inventory, orders, and shipments in real time across every stage - factory, freight, customs, warehouse, and doorstep - in one unified view. A 4PL delivers it faster than an in-house build because it already operates the integrations, the data model, and the control tower that visibility requires.
The gap between wanting that and having it is enormous. Only 6 percent of companies report full end-to-end visibility of their supply chain, according to the GEODIS Supply Chain Worldwide Survey, and the figure has barely moved in years. Meanwhile the tools have never been more available. That contradiction is the clue: visibility is not a software problem. It is an integration and data problem, and software is only the last step.
This guide covers what end-to-end supply chain visibility actually requires, what a control tower does and does not solve, and a seven-step build sequence. The final third shows how the same sequence looks when a 4PL runs it for you, using the Pi Data Center as a worked example.
What Is End-to-End Supply Chain Visibility?
End-to-end supply chain visibility is the ability to track products, orders, and shipments across every stage of the supply chain - from purchase order to final delivery - with data that is current, accurate, and unified in a single view. The operative word is unified. Most brands can see each stage somewhere: the freight forwarder has a portal, the warehouse has a system, each marketplace has a dashboard. What they cannot do is see one order flow through all of them without re-keying numbers into a spreadsheet.
True visibility has three tests:
- Timeliness: data reflects what happened minutes ago, not what was batch-uploaded last night
- Completeness: every stage is covered - inbound production, international freight, customs, warehousing, and last-mile parcel status
- Coherence: an SKU, an order, and a status mean the same thing in every system, so numbers can be compared without translation
Miss any of the three and you have reporting, not visibility. Reporting tells you what went wrong last week. Visibility tells you what is about to go wrong today.
Why Does Supply Chain Visibility Matter in 2026?
Visibility matters because disruption is now the normal operating condition, not the exception. In a 2025 Maersk survey of 2,000 European shipping customers, 76 percent had experienced supply chain disruptions that delayed their business in the past year, and 22 percent counted more than 20 separate incidents. You cannot manage a disruption you discover after your customer does.
The financial stakes are documented:
- Swiss Re estimates supply chain disruptions cost organizations roughly 184 billion dollars annually
- Analysis published by Global Banking and Finance Review in 2025 notes a single major disruption can erase up to 42 percent of a year's EBITDA for companies without diversified, agile operations
- Per the 2025 MHI and Deloitte Annual Industry Report, 55 percent of supply chain leaders are increasing technology investment, and 60 percent plan to spend more than 1 million dollars - with lack of accurate real-time data named as an ongoing barrier to end-to-end orchestration
For an international brand operating in the U.S. from another time zone, the case is sharper still. When your team wakes up, the U.S. business day is already half over. Without live visibility, every exception waits for an email cycle; freight delays become stockouts and marketplace penalties before anyone at headquarters even knows.
What Does Real-Time Visibility Actually Require?
Real-time visibility requires two unglamorous foundations before any dashboard: system integration, meaning live connections into every system that touches your goods, and data normalization, meaning those systems speak one shared language for SKUs, statuses, and timestamps. Skip either and the prettiest control tower on the market will confidently display wrong numbers.
The integration surface is wider than most teams expect:
| Data layer | Source systems | What it feeds |
|---|---|---|
| Orders and demand | Marketplaces, DTC storefront, retail EDI | Sales velocity, allocation, forecasting |
| Inventory | WMS at each warehouse, 3PL systems, FBA | Stock positions, replenishment triggers |
| In-transit freight | Carrier APIs, forwarder systems, AIS vessel data | ETAs, delay alerts, customs milestones |
| Fulfillment and parcel | WMS events, parcel carrier tracking | Promise dates, exception handling, chargeback defense |
Normalization is the step that makes the table above one system instead of four. It means a single SKU master across channels, one vocabulary for statuses (so a warehouse's "picked" and a carrier's "in transit" map to a shared order journey), and consistent timestamps across time zones. It is tedious work. It is also the entire difference between a control tower and a wall of contradicting widgets.
A note on latency: not every feed needs to be a live API. Retail EDI still runs on scheduled batches, and a nightly inventory sync is fine for slow-moving SKUs. What matters is matching data freshness to decision speed - parcel exceptions and marketplace stock levels need minutes, freight ETAs need hours, supplier scorecards can wait a week. Paying for real-time everywhere is a common way to overspend on a visibility project.
Gartner treats real-time transportation visibility platforms as their own software market for a reason: freight tracking alone is hard enough to support dedicated vendors. End-to-end visibility means joining that layer with warehouse, inventory, and order data those platforms never see.
What Is a Supply Chain Control Tower?
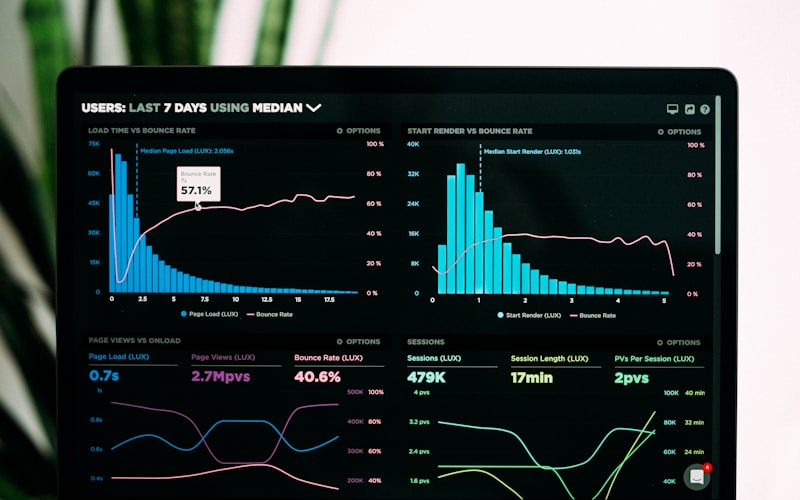
A supply chain control tower is the operating layer that sits on top of integrated, normalized data: live dashboards, milestone tracking against plan, and exception alerts that tell your team what needs attention right now. Think of it as air traffic control for your supply chain - it does not fly the planes, but nothing lands safely without it.
Demand for the concept is measurable. Grand View Research valued the control tower market at about 11.4 billion dollars in 2025, with a forecast compound annual growth rate near 23 percent through 2030. Mordor Intelligence puts the 2025 figure at 9.9 billion dollars - estimates differ, but every major analyst tracks it as one of the fastest-growing supply chain software categories.
A control tower earns its keep in three behaviors:
- Exception management: surfacing the 5 percent of orders and shipments that are off plan, so people stop reviewing the 95 percent that are fine
- Predictive alerts: flagging a late vessel as a future stockout while there is still time to expedite, reroute, or reallocate
- One version of the truth: sales, operations, and finance arguing about the decision instead of arguing about whose number is right
One honest limitation: a control tower is only as good as the data beneath it. Buying one before the integration and normalization work is done just moves the confusion onto a bigger screen.
How Do You Build End-to-End Supply Chain Visibility?
Building end-to-end supply chain visibility takes seven steps: map your flows, audit your systems, integrate the data layer, normalize it, add milestone and exception logic, layer on analytics, and assign ownership. Done in-house, the sequence typically takes 12 to 24 months. A 4PL compresses it because steps 3 through 6 already exist as shared infrastructure.
Step 1: Map your physical and data flows
Draw every path a product takes from factory to customer, then overlay the system that records each stage. The gaps become obvious fast: most brands find at least one stage - often customs brokerage or inbound receiving - where the only record is an email thread.
Step 2: Audit systems and name the gaps
For each system in the map, record what data it holds, whether it has an API or EDI capability, and how current its data is. Score each stage red, yellow, or green. This audit becomes your integration backlog and your business case.
Step 3: Integrate the transaction layer
Connect order sources first - marketplaces, storefront, retail EDI - then warehouses, then freight and parcel carriers. Prioritize by decision value: inventory and order feeds prevent oversells today, while freight feeds mostly improve planning. Resist point-to-point spaghetti; route everything into one data platform.
Step 4: Normalize the data
Build the single SKU master, the shared status vocabulary, and the timestamp conventions described above. Assign a data owner for each master file. This step has no visible demo, which is why in-house projects skip it - and why they fail.
Step 5: Add milestone tracking and exception logic
Define the milestones an order or shipment should hit and when. Then define the alerts that fire when reality misses the plan:
- Vessel or flight ETA slips more than 48 hours against the inbound plan
- Inventory cover at any node falls below two weeks of forecast demand
- A parcel misses its promise date, or a retail shipment risks an on-time-in-full penalty
- Received quantity at the warehouse does not match the advance shipping notice
Every alert needs a named owner and a written playbook, or the queue becomes noise that everyone learns to ignore within a month.
Step 6: Layer analytics and forecasting
With clean, unified data flowing, forecasting finally has something to eat. Demand models, replenishment recommendations, and freight lead-time analytics all improve with each week of normalized history. This is where visibility stops being defensive and starts funding itself through smarter inventory decisions.
Step 7: Assign ownership and an operating cadence
Visibility is a practice, not a project. Someone runs the exception queue daily, someone reviews forecast accuracy weekly, and someone owns data quality. Without the cadence, dashboards decay into wallpaper within a quarter.
Where Does a 4PL Fit in Supply Chain Visibility?
A 4PL changes the build-versus-buy math because it already operates most of the stack. The warehouse integrations, freight tracking feeds, marketplace connections, and normalized data model exist as shared infrastructure across the 4PL's client base. Onboarding a new brand means connecting sources to a working platform, not building one - weeks instead of years.
Stage matters here. A small single-channel brand can run visibility from its storefront dashboard and a spreadsheet. A scaling domestic brand may do well with a visibility platform license and a part-time analyst. The 4PL route fits when you operate multiple channels, multiple warehouses, and international freight at once - the point where integrated orchestration is worth paying for because no single internal hire can cover the surface area.
The trade-off deserves plain language: you are adopting the 4PL's data model rather than owning your own, and that creates switching costs if you leave. Negotiate data export rights, API access to your own records, and explicit ownership of your historical data before signing. A credible 4PL agrees to all three without friction.
Worked Example: How the Pi Data Center Delivers Visibility
The Pi Data Center, the commerce data platform inside Pi-Commerce's 4PL service, is a concrete implementation of the seven steps above. Orders flow in from Amazon, Walmart, Target, TikTok Shop, and DTC storefronts; inventory syncs from every warehouse in the network; freight milestones arrive from carrier and forwarder feeds. Normalization runs on one SKU master and one order-journey vocabulary, so a unit is countable at any point between factory gate and doorstep.
On top of that layer sit the control tower behaviors: exception queues worked daily by Pi-Commerce operators in U.S. time zones, and AI demand forecasting trained on each brand's unified history. One Pi-Commerce electronics client entering the U.S. market used vessel-delay alerts to reroute two late containers to an East Coast node ahead of a marketplace promotion - the stockout that did not happen never shows up in a report, which is exactly the point of visibility.
How Pi-Commerce Helps You See Your Whole Supply Chain
Pi-Commerce operates as a U.S. 4PL for international brands, and end-to-end supply chain visibility is the operating system of the service, not an add-on. Your team gets the Pi Data Center view - orders, inventory, freight, and forecasts in one place - while our operators run the daily exception cadence in U.S. hours, so problems get handled while your headquarters sleeps.
If you are weighing an in-house visibility build against the 4PL route, talk to our team. We will walk through your current system map, show you what the Pi Data Center would connect in your first 30 days, and be straightforward about the data-ownership terms - including where an in-house build genuinely serves you better.


